
4.4. Назначение пунктов меню Run, Compile, Debug. Меню выполнения программы (Run)
Run (запустить программу) Запускает программу, если ее исходный текст не был изменен. Если текст программы был изменен, то при очередном запуске программы происходит ее перекомпиляция
Trace into (трассировка с заходом в подпрограммы) Выполняет те же действия, что и команда Step over (см. выше), однако если встречается подпрограмма, она также выполняется по отдельным строкам.
Go to cursor (выполнить до строки, помеченной курсором) Ctrl+Break
Program reset (прекратить выполнение программы)
Parameters (параметры) Позволяет задать параметры программе точно так же, как они задаются при запуске программы с помощью командной строки.
Меню компиляции (Compile)
Compile (компиляция) Осуществляет компиляцию файла, находящегося в активном окне. В случае обнаружения синтаксической ошибки выдается сообщение об этой ошибке, а курсор помещается в место ее нахождения. Если ошибки не обнаружены, выдается сообщение об успешной компиляции.
Make (собрать программу) Если тексты отдельных модулей, которые используются основной программой или основным модулем, были изменены после получения объектных файлов, то соответствующие модули перекомпилируются, после чего компилируется файл, содержащий основную программу или основной модуль.
Build (создать программу) Работает аналогично Make, только все модули, которые используются основной программой или основным модулем, перекомпилируются в любом случае.
Primary file (основной файл) Устанавливает основной файл программы для команд Make и Build. В этом случае выполнение этих команд начинается с компиляции этого основного файла, даже если он находится не в активном окне и даже если он вообще не открыт к моменту компиляции.
Clear primary file (отказаться от основного файла) Сбрасывается заданное командой Primary file имя основного файла. В этом случае любая компиляция начинается с файла, находящегося в активном окне.
Information (получить информацию о файле) Выводит информацию о текущем файле и оперативной памяти.
Меню отладки (Debug)
Breakpoints (работа с точками останова) Позволяет работать с окном точек останова
Call stack (окно используемых подпрограмм) Открывается и активизируется окно используемых подпрограмм.
Register (окно регистров) Открывается и активизируется окно регистров.
Watch (окно отладки) Открывается и активизируется окно отладки.
Output (окно выходных результатов)
User screen (окно пользователя)
Evaluate/modify (вычислить/модифицировать) Позволяет задать переменную или выражение, для которого следует вычислить значение, а также задать новое значение для переменной.
Add watch (добавить наблюдаемый параметр) Добавляет в окно наблюдаемых параметров новый параметр переменную или выражение).
Add breakpoint (добавить точку останова) Задает точку останова и условия останова.
Тут вы можете оставить комментарий к выбранному абзацу или сообщить об ошибке.
Программирование на Visual Basic (VB)
Дата добавления: 2014-12-02 ; просмотров: 1012 ; Нарушение авторских прав
1. Общая характеристика интерфейса и режимы работы среды программирования.
2. Меню среды программирования: Format, Debug, File, View, Run.
3. Файлы, создаваемые средой программирования.
4. Типы ошибок: синтаксические, при выполнении программы, логические.
6. Общая характеристика объектов интерфейса пользователя: свойства, методы, события.
7. Свойства формы интерфейса пользователя, установка свойств.
8. Методы формы интерфейса пользователя: Cls, Print, Hide, Line, Show.
9. Свойства командных кнопок, меток и текстовых окон.
10. Свойства графического окна, управление цветом в графическом окне.
11. Этапы подготовки и решения задач.
12. Понятие об алгоритме решения задачи. Представление алгоритмов в виде графических схем.
13. Типы данных в языке Visual Basic. Совместимость и преобразование типов данных.
14. Объявление констант и переменных различного типа.
15. Массивы. Размерность массива. Объявление статического и динамического массива.
16. Область видимости переменной (глобальные, локальные, статические переменные).
17. Арифметические операции, приоритет выполнения операций.
18. Логические операции и отношения. Операции с текстовыми данными.
20. Типы функций в языке Visual Basic.
21. Использование функций MsgBox и InputBox: аргументы и использование возвращаемого значения.
22. Процедуры и функции пользователя: структура, способы передачи и возврата данных.
24. Организация множественного выбора вычислений: оператор Select Case и его синтаксис.
25. Определение единиц измерения для графического окна.
26. Задание системы координат для графического окна.
27. Методы графического окна: Pset, Line, Cls.
Работа с электронными таблицами MS Excel
2. Понятие о рабочей книге и рабочих листах.
3. Ввод и изменение информации на рабочем листе.
4. Создание, редактирование таблицы.
5. Операции с ячейками.
7. Формулы в MS Excel.
8. Выполнение вычислений.
9. Расчет по функциям
10. Перемещение и копирование данных.
11. Форматирование ячейки или диапазона ячеек.
12. Форматирование чисел и текста.
13. Управление отображением текста.
14. Графические возможности MS Excel.
15. Построение диаграмм.
16. Быстрое создание диаграммы.
17. Редактирование диаграммы.
18. Особенности построения графиков.
ЛИТЕРАТУРА
В методических указаниях для каждой темы даются ссылки на литературу в соответствии с приведенной нумерацией и с указанием страниц или разделов, например:
ВНИМАНИЕ.
Желательно учебник [1] купить. Он издан в честь 300-летия С.-Петербурга!
Редактор Visual Basic
Редактор Visual Basic позволяет записывать, сохранять и модифицировать программные модули, выполнять и отлаживать процедуры.
В среду редактора VBA можно перейти
Возврат в рабочую книгу MS Excel из редактора VBA выполняется
Окна редактора VB
Project Window (окно проекта)
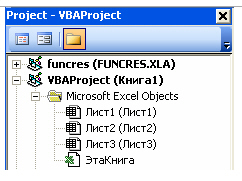
Структура проекта имеет вид дерева. Элементы структуры могут быть свернуты или расширены нажатием на пиктограммы «+» или «-«, расположенные слева от папок, составляющих проект.
Показать окно проекта можно при помощи:
По мере разработки пользовательского приложения добавляются
На процедурном листе, связанном с объектом, размещаются процедуры обработки событий этого объекта и дополнительно могут размещаться процедуры общего типа и процедуры-функции, необходимые для выполнения событийных процедур.
Переход на процедурный лист любого объекта проекта производится следующими способами:
Стандартные модули содержат:
После записи оператора начала процедуры вручную и нажатия клавиши Enter конец процедуры записывается автоматически.
Для вставки процедуры установите точку вставки в тело модуля и выполните команду Procedure (Процедура) из меню Insert (Вставка).
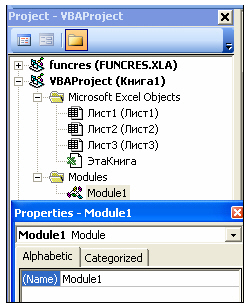
Properties Window (Окно свойств)
Окно свойств показывает и позволяет изменять свойства объекта, выделенного в окне проекта или в окне формы. Для вызова окна свойств используйте клавишу F4 или пиктограмму
Изменение свойства Name приводит к изменению имени объекта, под которым этот объект известен всем процедурам проекта.
Свойства объектов можно изменять в режиме конструктора ( Design time ) или в режиме выполнения процедуры ( Run time ). Некоторые свойства объектов можно изменять в любом режиме, а отдельные свойства подлежат изменению только в режиме конструктора или только в режиме выполнения процедуры. Если свойства объектов изменяются в режиме выполнения процедуры, то они никогда не видны в окне свойств объекта.
Code (окно программы)
Окно открывается при выполнении команды Code (Программа) из меню View или при нажатии клавиши F7. Можно нажать кнопку View Code ( рис. 2.2) или сделать двойной щелчок на имени модуля, объекта рабочей книги или формы.
Меню и панели инструментов Visual Basic
При переходе в редактор VB меняется меню и появляется стандартная панель инструментов Visual Basic.
Пиктограммы отладки программ расположены на отдельной панели инструментов, которая высвечивается командой View-Toolbars-Debug.
Запуск и обзор команд главного меню
Для запуска среды Free Pascal можно воспользоваться ярлыком с рабочего стола Windows или выполнить последовательность команд главного меню Start / All Programs / Free Pascal (Пуск / Все программы / Free Pascal). В состав главного меню, расположенного в верхней части окна (рисунок 1) входят команды:
· File (Файл) − для работы с файлами;
· Edit (Правка) − редактирование файла;
· Search (Поиск) − поиск или замена фрагментов текста;
· Run (Прогон) − выполнение программы;
· Compile (Компиляция) − компиляция программы;
· Debug (Отладка) − отладка;
· Tools (Сервис) − команды вспомогательного характера;
· Options (Параметры) − настройка среды программирования;
· Window(Окно) − для работы с окнами документов;
· Help (Помощь, Справка) − вызов справочной информации.
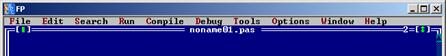
Рисунок 1 − Главное меню Free Pascal
В нижней части окна программы находится описание некоторых функциональных клавиш, список которых изменяется в зависимости от выполняемой команды главного меню (рисунок 2).

Рисунок 2 − Строка функциональных клавиш Free Pascal
Основные команды меню File:
· New – создать новый документ;
· Save (F2) (Save as…) – сохранить, сохранить как…;
· Open (F3) – открыть существующий файл;
· Print – печать;
· Exit (Alt X) – выход;
· Change Dir – изменение текущего директория.
В меню Edit входят команды:
· Undo (Alt Backspace) – отмена действия;
· Redo – возврат на действие вперед;
· Copy (Ctrl Ins) – копировать;
· Cut (Shift Del) – вырезать;
· Clear (Ctrl Del) – удалить;
· Paste (Shift Ins) – вставить;
· Select All − выделить все;
· Unselect − снять выделение;
· Show Clipboard – просмотреть содержимое буфера обмена;
· Copy to Windows – копировать в Windows;
· Paste from Windows – вставить из Windows.
Посредством меню Search (Поиск) можно выполнить команды:
· Find − найти фрагмент текста;
· Replace − заменить;
· Go to line number − перейти к строке с указанным номером.
В меню Run (Выполнение) собраны команды, предназначены для выполнения программы:
· Run (Ctrl F9) – компиляция, выполнение, вывод результатов работы программы;
· Trace into (F7) – трассировка, пошаговое выполнение программы;
· Step over (F8) – выполнение программы по шагам, без отслеживания работы вызываемых процедур и функций;
· Go to cursor (F4) – выполнение программы до строки, помеченной курсором в текущем окне редактора;
· Program reset (Ctrl F2) – сброс всех ранее задействованных отладочных свойств, прекращение отладки программы, удаление из памяти исполнявшейся программы.
Компиляция программы выполняется выбором пунктов меню Compile (Компиляция) одной из команд Compile (Alt F9), Make (F9) или Build. Здесь же находится команда Information, показывающая статистику программы.
Посредством меню Debug (Отладка) чаще других выполняются команды:
· Output − открытие окна, в котором отображаются на экране результаты выполнения программы в текстовом режиме;
· User screen (Alt F5) – переход в окно результатов выполнения программы.
Меню Tools (Сервис) содержит команды вызова встроенного калькулятора (Calculator), таблицы кодов (Ascii table) и некоторые другие.
В меню Options (Параметры) доступны команды настройки, управления генерацией машинного кода программы, регулирующие размер памяти, режим работы компоновщика и т. д. В дополнительном подменю команды Environment собраны пункты:
· Preferences – параметры, определяющие условия работы в целом;
· Editor – параметры, определяющие условия работы редактора;
· Startup – опции, определяющие начальные параметры;
· Colors – цвет для каждого из элементов Free Pascal.
Команды для работы с окнами документов находятся в пункте главного меню Window(Окно):
· Tile – расположение окон всех открытых документов равномерно по всему экрану;
· Cascade – расположение открытых окон каскадом;
· Close all − закрытие всех окон;
· Refresh display − обновление экрана;
· Size / Move (Ctrl F5) − изменение размера и расположения окна на экране (см. функциональные клавиши внизу окна);
· Zoom (F5) – масштабирование окна;
· Next (F6) – активизация следующего окна;
· Previous (Shift F6)– активизация предыдущего окна;
· List (Alt 0) – вывод на экран списка всех открытых окон среды;
· Close ( Alt F3) – закрытие окна текущего документа.
В пункте главного меню Help (Помощь), в частности, находятся:
· Content – вывод содержания справочной службы;
· Index – алфавитный перечень всех ссылок справочной службы;
· Topic search – поиск в окрестности курсора зарезервированного слова, стандартной функции и выдача соответствующей справки;
· Previous topic – предыдущее справочное сообщение;
· About − информация о программе.
Основные функциональные клавиши и комбинации клавиш:
· Esc− отмена команды;
· F1 − обращение за справкой к встроенной справочной службе;
· F2 − сохранение редактируемого текста программы в дисковый файл;
· F3 − вызов окна открытия файла;
· F9 − компиляция программы без последующего выполнения;
· F10 − активизация пунктов главного меню;
· Alt F9 − компиляция программы;
· Ctrl F9 − прогон программы: компиляция программы, находящейся в редакторе, загрузка ее в оперативную память и выполнение;
· Alt F3 − закрытие активного окна документа;
· Alt F5 − отображение окна вывода результатов работы программы;
· Alt F10 – вызов контекстного (локального) меню;
· Alt Х – закрытие окна приложения (среды программирования).
1 Если активизировать главное меню нажатием клавиши F10, то любую команду можно выбрать с помощью клавиш управления курсором и подтвердить выбор нажатием клавиши Enter.
1.1.2 Создание, открытие и сохранение файла документа. Работа с окнами
Для создания окна нового документа выполняют последовательно File / New (Файл / Создать). Каждый новый файл получает имя и порядковый номер, отображаемые в верхней части окна документа, например, noname01.pas. Номер открытого документа в текущем сеансе работы отображается справа от имени файла.
Примечание – Закрывающая кнопка окна документа  находится в левой, а масштабирующая
  − в правой верхней части окна документа.
Одновременно в редакторе интегрированной среды может быть открыто несколько окон с программами. Переход между окнами осуществляется с помощью клавиши F6. Закрывается активное окно редактора (но не приложения Free Pascal) комбинацией клавиш Alt F3. Остальные команды для работы с окнами находятся в меню Window (Окно).
Новый файл следует сразу сохранить в личной папке, выполнив команду File / Save as (Файл / Сохранить как). За клавишей F2 закреплено дублирование этой команды. В процессе работы нажимайте клавишу F2 всякий раз, когда вносите изменения в текст создаваемой программы.
Для вызова диалогового окна открытия уже существующего файла используется последовательность команд File / Open (Файл / Открыть) или клавиша F3.
Примечание – Сохранение пустого документа («чистого окна редактора») с именем ранее созданного пользователем файла программы приводит к потере этой программы.

Организация стока поверхностных вод: Наибольшее количество влаги на земном шаре испаряется с поверхности морей и океанов (88‰).
Механическое удерживание земляных масс: Механическое удерживание земляных масс на склоне обеспечивают контрфорсными сооружениями различных конструкций.
Debugging
One of the key features of Visual Studio Code is its great debugging support. VS Code’s built-in debugger helps accelerate your edit, compile, and debug loop.
Debugger extensions
VS Code has built-in debugging support for the Node.js runtime and can debug JavaScript, TypeScript, or any other language that gets transpiled to JavaScript.
For debugging other languages and runtimes (including PHP, Ruby, Go, C#, Python, C++, PowerShell and many others), look for Debuggers extensions in the VS Code Marketplace or select Install Additional Debuggers in the top-level Run menu.
Below are several popular extensions which include debugging support:
Tip: The extensions shown above are dynamically queried. Select an extension tile above to read the description and reviews to decide which extension is best for you.
Start debugging
The following documentation is based on the built-in Node.js debugger, but most of the concepts and features are applicable to other debuggers as well.
It is helpful to first create a sample Node.js application before reading about debugging. You can follow the Node.js walkthrough to install Node.js and create a simple «Hello World» JavaScript application ( app.js ). Once you have a simple application set up, this page will take you through VS Code debugging features.
Run view
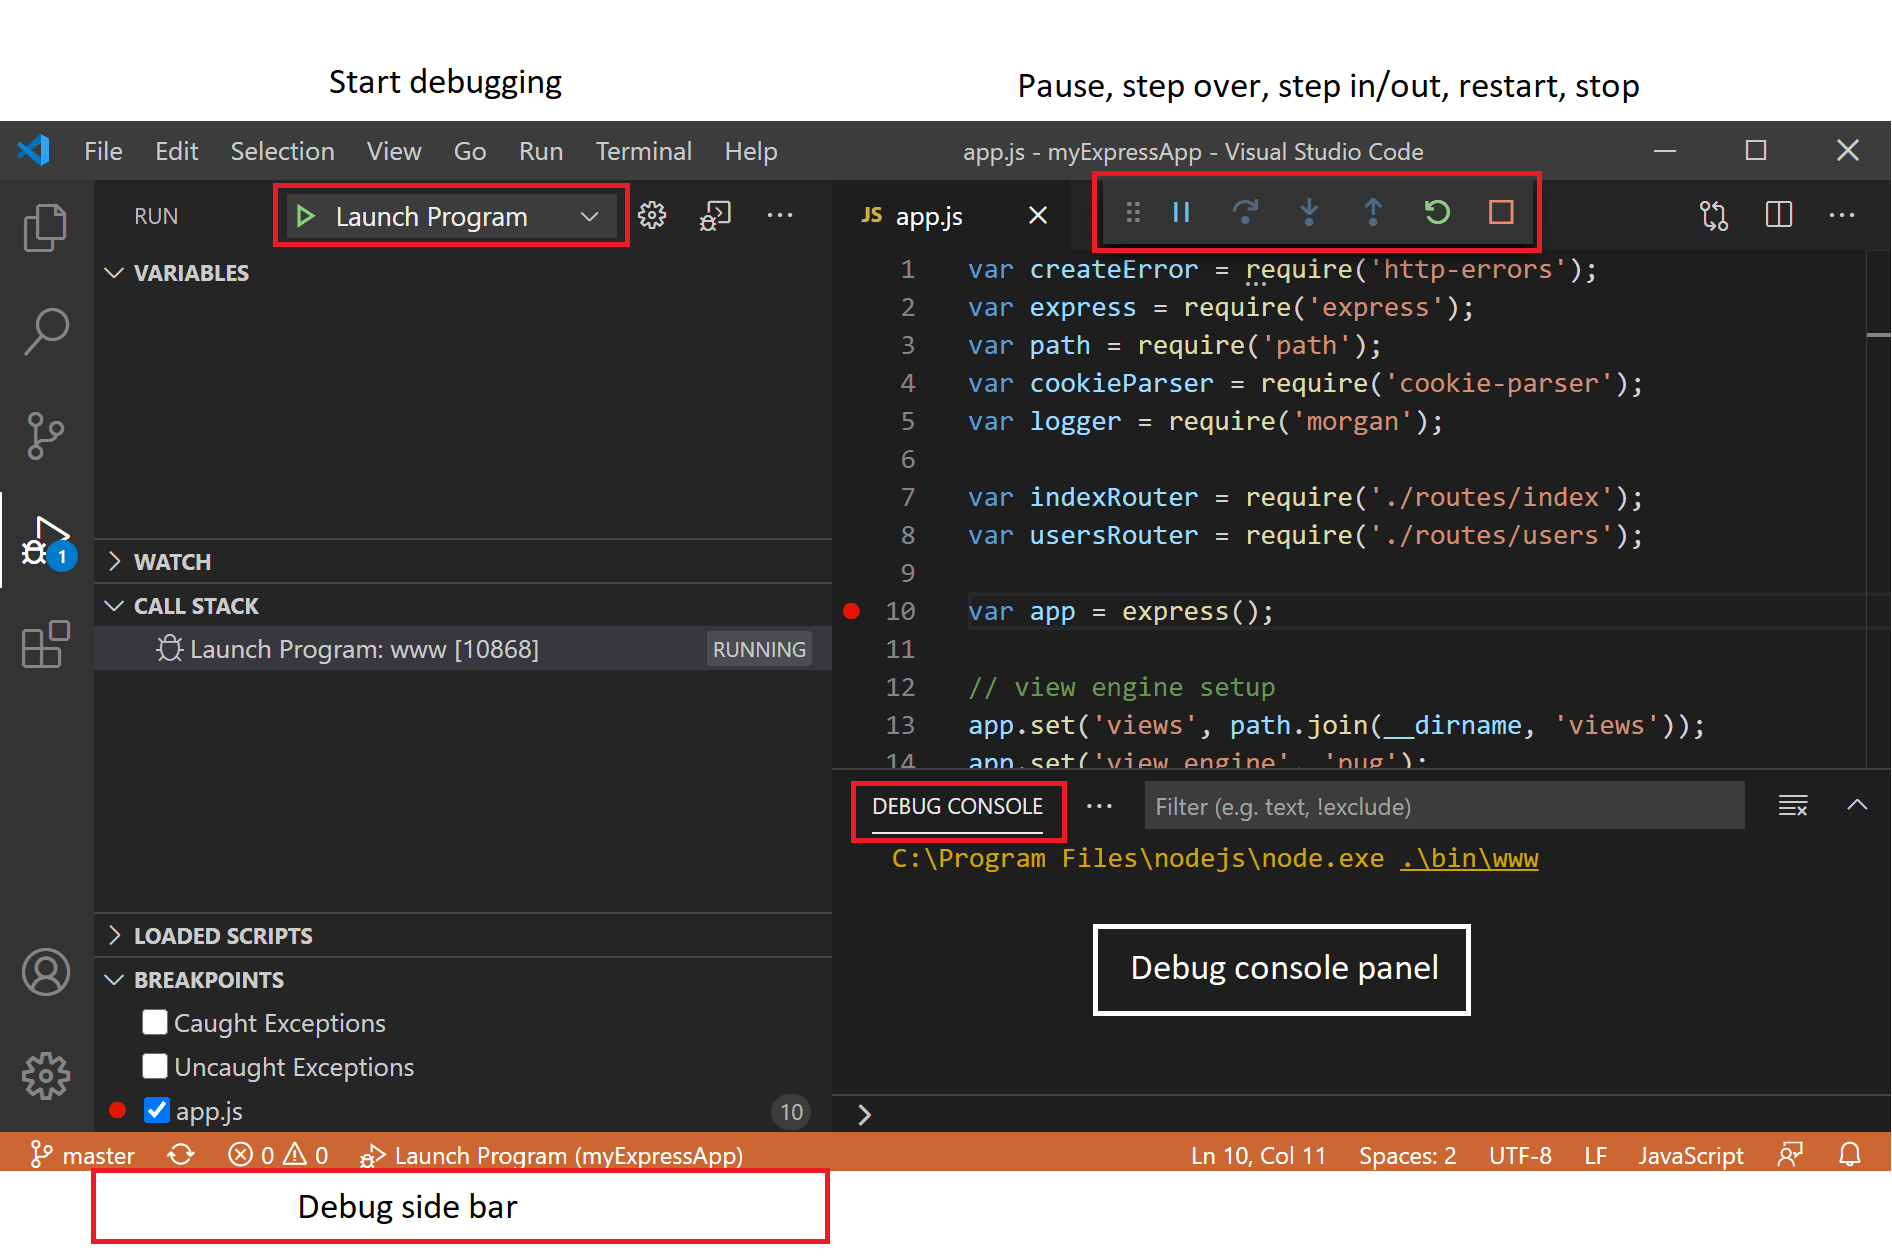
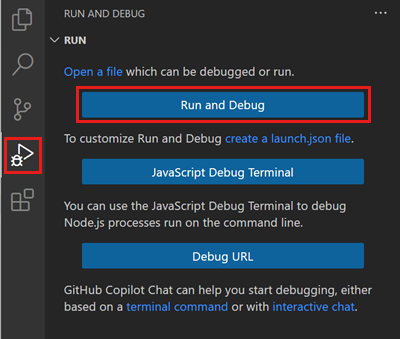
The Run view displays all information related to running and debugging and has a top bar with debugging commands and configuration settings.
If running and debugging is not yet configured (no launch.json has been created), VS Code shows the Run start view.
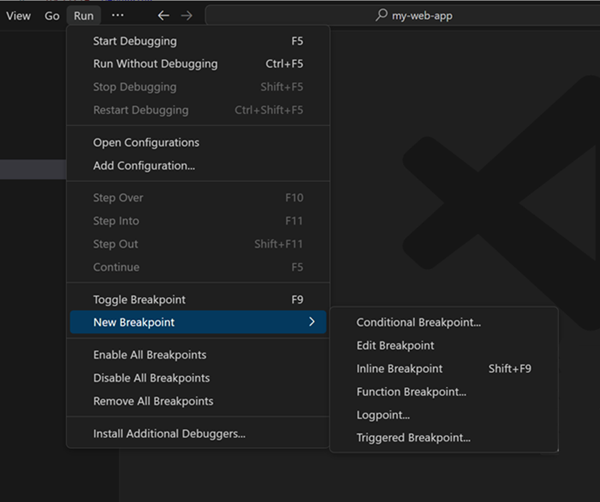
Run menu
The top-level Run menu has the most common run and debug commands:
Launch configurations
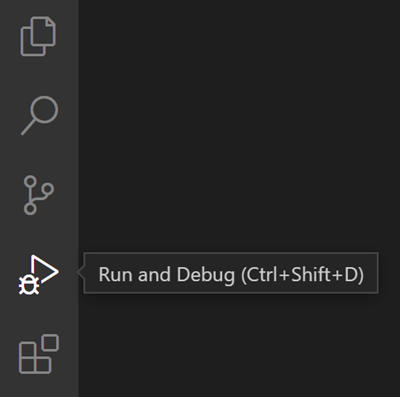
To run or debug a simple app in VS Code, select Run and Debug on the Debug start view or press F5 and VS Code will try to run your currently active file.
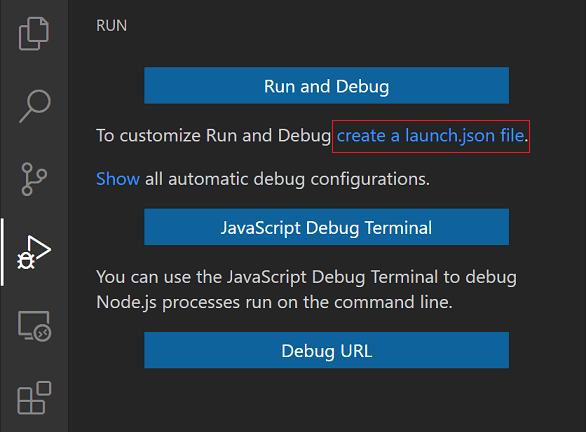
To create a launch.json file, click the create a launch.json file link in the Run start view.
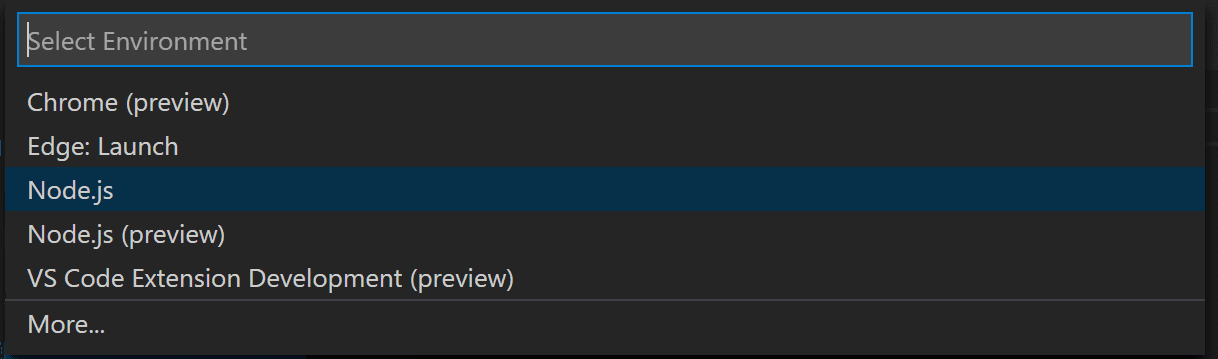
VS Code will try to automatically detect your debug environment, but if this fails, you will have to choose it manually:
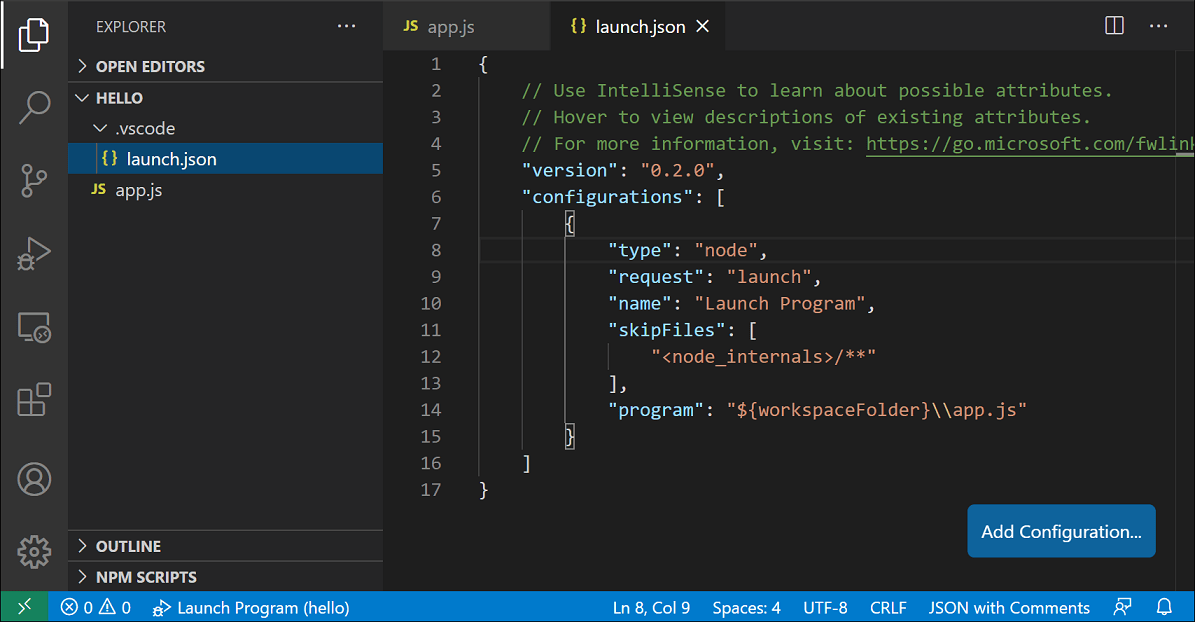
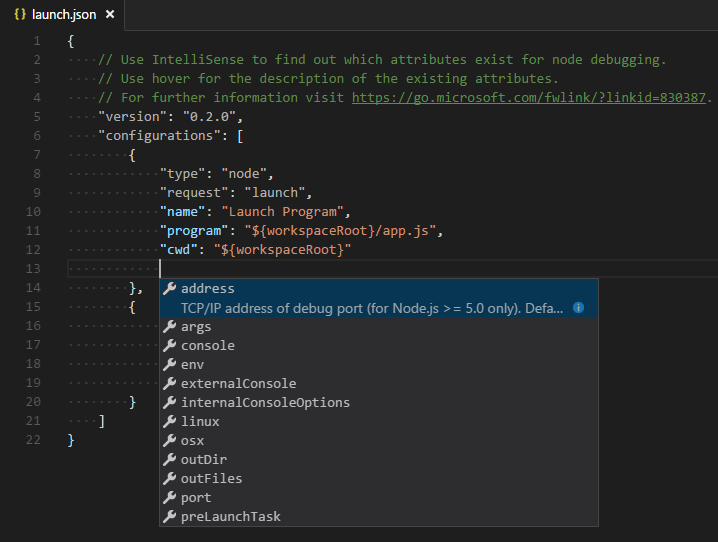
Here is the launch configuration generated for Node.js debugging:
Note: You can debug a simple application even if you don’t have a folder open in VS Code, but it is not possible to manage launch configurations and set up advanced debugging. The VS Code Status Bar is purple if you do not have a folder open.
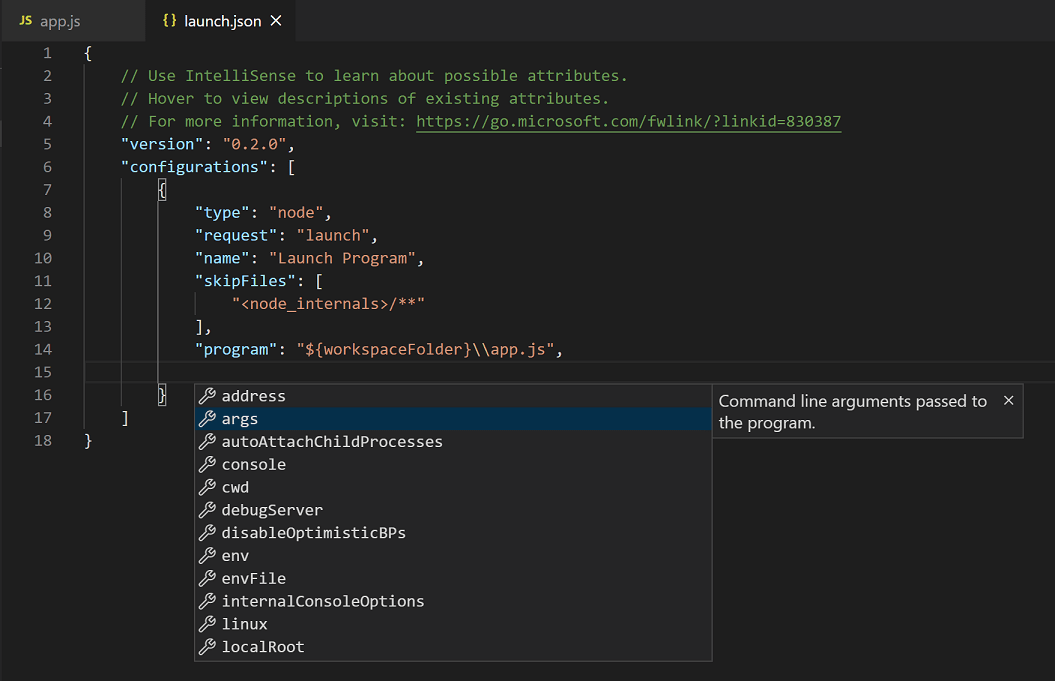
Note that the attributes available in launch configurations vary from debugger to debugger. You can use IntelliSense suggestions ( ⌃Space (Windows, Linux Ctrl+Space ) ) to find out which attributes exist for a specific debugger. Hover help is also available for all attributes.
Do not assume that an attribute that is available for one debugger automatically works for other debuggers too. If you see green squiggles in your launch configuration, hover over them to learn what the problem is and try to fix them before launching a debug session.
Review all automatically generated values and make sure that they make sense for your project and debugging environment.
Launch versus attach configurations
In VS Code, there are two core debugging modes, Launch and Attach, which handle two different workflows and segments of developers. Depending on your workflow, it can be confusing to know what type of configuration is appropriate for your project.
If you come from a browser Developer Tools background, you might not be used to «launching from your tool,» since your browser instance is already open. When you open DevTools, you are simply attaching DevTools to your open browser tab. On the other hand, if you come from a server or desktop background, it’s quite normal to have your editor launch your process for you, and your editor automatically attaches its debugger to the newly launched process.
The best way to explain the difference between launch and attach is to think of a launch configuration as a recipe for how to start your app in debug mode before VS Code attaches to it, while an attach configuration is a recipe for how to connect VS Code’s debugger to an app or process that’s already running.
VS Code debuggers typically support launching a program in debug mode or attaching to an already running program in debug mode. Depending on the request ( attach or launch ), different attributes are required, and VS Code’s launch.json validation and suggestions should help with that.
Add a new configuration
VS Code also supports compound launch configurations for starting multiple configurations at the same time; for more details, please read this section.
Alternatively, you can run your configuration through the Command Palette ( ⇧⌘P (Windows, Linux Ctrl+Shift+P ) ) by filtering on Debug: Select and Start Debugging or typing ‘debug ‘ and selecting the configuration you want to debug.
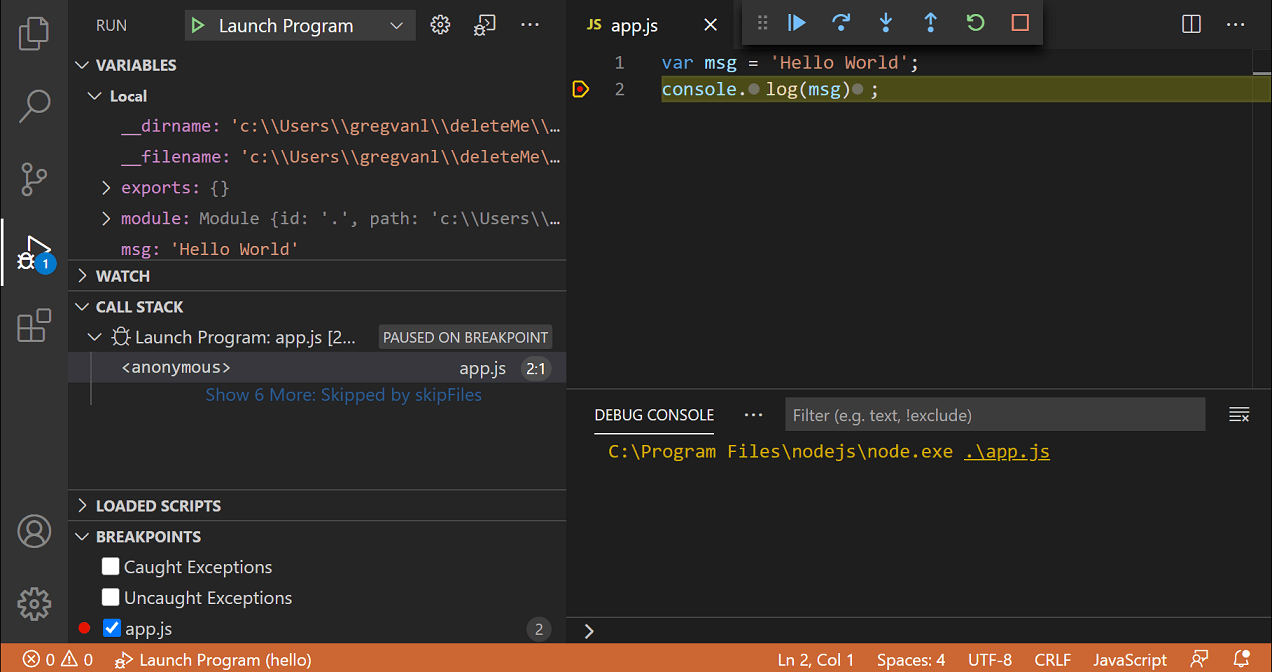
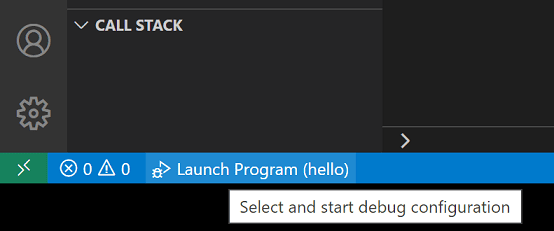
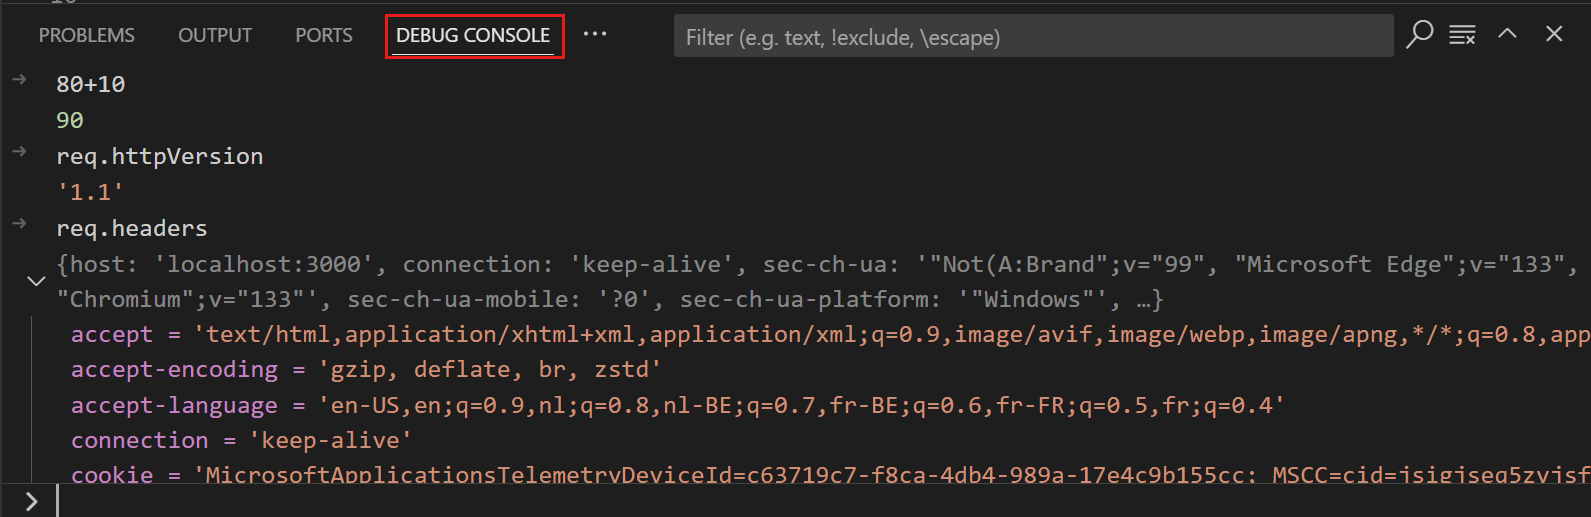
As soon as a debugging session starts, the DEBUG CONSOLE panel is displayed and shows debugging output, and the Status Bar changes color (orange for default color themes):
In addition, the debug status appears in the Status Bar showing the active debug configuration. By selecting the debug status, a user can change the active launch configuration and start debugging without needing to open the Run view.
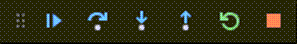
Debug actions
Once a debug session starts, the Debug toolbar will appear on the top of the editor.
Run mode
In addition to debugging a program, VS Code supports running the program. The Debug: Run (Start Without Debugging) action is triggered with ⌃F5 (Windows, Linux Ctrl+F5 ) and uses the currently selected launch configuration. Many of the launch configuration attributes are supported in ‘Run’ mode. VS Code maintains a debug session while the program is running, and pressing the Stop button terminates the program.
Tip: The Run action is always available, but not all debugger extensions support ‘Run’. In this case, ‘Run’ will be the same as ‘Debug’.
Breakpoints
Breakpoints can be toggled by clicking on the editor margin or using F9 on the current line. Finer breakpoint control (enable/disable/reapply) can be done in the Run view’s BREAKPOINTS section.
If the debugger supports breaking on different kinds of errors or exceptions, those will also be available in the BREAKPOINTS view.
The Reapply All Breakpoints command sets all breakpoints again to their original location. This is helpful if your debug environment is «lazy» and «misplaces» breakpoints in source code that has not yet been executed.

Optionally, breakpoints can be shown in the editor’s overview ruler by enabling the setting debug.showBreakpointsInOverviewRuler :

Logpoints
A Logpoint is a variant of a breakpoint that does not «break» into the debugger but instead logs a message to the console. Logpoints are especially useful for injecting logging while debugging production servers that cannot be paused or stopped.
A Logpoint is represented by a «diamond» shaped icon. Log messages are plain text but can include expressions to be evaluated within curly braces (‘<>‘).
Just like regular breakpoints, Logpoints can be enabled or disabled and can also be controlled by a condition and/or hit count.
Note: Logpoints are supported by VS Code’s built-in Node.js debugger, but can be implemented by other debug extensions. The Python and Java extensions, for example, support Logpoints.
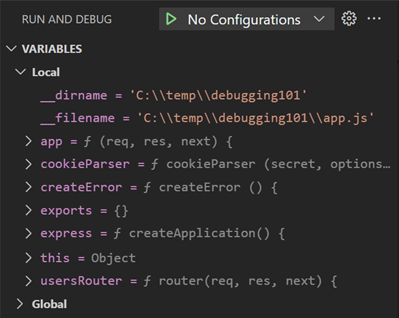
Data inspection
Variables can be inspected in the VARIABLES section of the Run view or by hovering over their source in the editor. Variable values and expression evaluation are relative to the selected stack frame in the CALL STACK section.
Variable values can be modified with the Set Value action from the variable’s context menu. Additionally, you can use the Copy Value action to copy the variable’s value, or Copy as Expression action to copy an expression to access the variable.
Variables and expressions can also be evaluated and watched in the Run view’s WATCH section.

Variable names and values can be filtered by typing while the focus is on the VARIABLES section.

Launch.json attributes
There are many launch.json attributes to help support different debuggers and debugging scenarios. As mentioned above, you can use IntelliSense ( ⌃Space (Windows, Linux Ctrl+Space ) ) to see the list of available attributes once you have specified a value for the type attribute.
The following attributes are mandatory for every launch configuration:
Here are some optional attributes available to all launch configurations:
Many debuggers support some of the following attributes:
Variable substitution
Platform-specific properties
Launch.json supports defining values (for example, arguments to be passed to the program) that depend on the operating system where the debugger is running. To do so, put a platform-specific literal into the launch.json file and specify the corresponding properties inside that literal.
Below is an example that passes «args» to the program differently on Windows:
Valid operating properties are «windows» for Windows, «linux» for Linux, and «osx» for macOS. Properties defined in an operating system specific scope override properties defined in the global scope.
Please note that the type property cannot be placed inside a platform-specific section, because type indirectly determines the platform in remote debugging scenarios, and that would result in a cyclic dependency.
In the example below, debugging the program always stops on entry except on macOS:
Global launch configuration
VS Code supports adding a «launch» object inside your User settings. This «launch» configuration will then be shared across your workspaces. For example:
Advanced breakpoint topics
Conditional breakpoints
A powerful VS Code debugging feature is the ability to set conditions based on expressions, hit counts, or a combination of both.
You can add a condition and/or hit count when creating a source breakpoint (with the Add Conditional Breakpoint action) or when modifying an existing one (with the Edit Condition action). In both cases, an inline text box with a dropdown menu opens where you can enter expressions:
Condition and hit count editing support is also supported for function and exception breakpoints. You can initiate condition editing from the context menu or the new inline Edit Condition action.
An example of condition editing in the BREAKPOINTS view: 
If a debugger does not support conditional breakpoints, the Add Conditional Breakpoint and Edit Condition actions will be missing.
Inline breakpoints
Inline breakpoints will only be hit when the execution reaches the column associated with the inline breakpoint. This is particularly useful when debugging minified code which contains multiple statements in a single line.
An inline breakpoint can be set using ⇧F9 (Windows, Linux Shift+F9 ) or through the context menu during a debug session. Inline breakpoints are shown inline in the editor.
Inline breakpoints can also have conditions. Editing multiple breakpoints on a line is possible through the context menu in the editor’s left margin.
Function breakpoints
Instead of placing breakpoints directly in source code, a debugger can support creating breakpoints by specifying a function name. This is useful in situations where source is not available but a function name is known.
A function breakpoint is created by pressing the + button in the BREAKPOINTS section header and entering the function name. Function breakpoints are shown with a red triangle in the BREAKPOINTS section.
Data breakpoints
If a debugger supports data breakpoints, they can be set from the VARIABLES view and will get hit when the value of the underlying variable changes. Data breakpoints are shown with a red hexagon in the BREAKPOINTS section.
Debug Console REPL
Note: You must be in a running debug session to use the Debug Console REPL.
Redirect input/output to/from the debug target
Redirecting input/output is debugger/runtime specific, so VS Code does not have a built-in solution that works for all debuggers.
Here are two approaches you might want to consider:
Launch the program to debug («debug target») manually in a terminal or command prompt and redirect input/output as needed. Make sure to pass the appropriate command line options to the debug target so that a debugger can attach to it. Create and run an «attach» debug configuration that attaches to the debug target.
If the debugger extension you are using can run the debug target in VS Code’s Integrated Terminal (or an external terminal), you can try to pass the shell redirect syntax (for example, » «) as arguments.
Here’s an example launch.json configuration:
This approach requires that the » preLaunchTask can be specified that is run before the individual debug sessions are started.
Compound launch configurations are displayed in the launch configuration dropdown menu.
Remote debugging
VS Code does not itself support remote debugging: this is a feature of the debug extension you are using, and you should consult the extension’s page in the Marketplace for support and details.
There is, however, one exception: the Node.js debugger included in VS Code supports remote debugging. See the Node.js Debugging topic to learn how to configure this.
Automatically open a URI when debugging a server program
Developing a web program typically requires opening a specific URL in a web browser in order to hit the server code in the debugger. VS Code has a built-in feature «serverReadyAction» to automate this task.
Here is an example of a simple Node.js Express application:
This application first installs a «Hello World» handler for the «/» URL and then starts to listen for HTTP connections on port 3000. The port is announced in the Debug Console, and typically, the developer would now type http://localhost:3000 into their browser application.
The serverReadyAction feature makes it possible to add a structured property serverReadyAction to any launch config and select an «action» to be performed:
Here the pattern property describes the regular expression for matching the program’s output string that announces the port. The pattern for the port number is put into parenthesis so that it is available as a regular expression capture group. In this example, we are extracting only the port number, but it is also possible to extract a full URI.
The uriFormat property describes how the port number is turned into a URI. The first %s is substituted by the first capture group of the matching pattern.
The resulting URI is then opened outside of VS Code («externally») with the standard application configured for the URI’s scheme.
Trigger Debugging via Edge or Chrome
To simplify things a bit, most properties are optional and we use the following fallback values:
Triggering an Arbitrary Launch Config
In some cases, you may need to configure additional options for the browser debug session—or use a different debugger entirely. You can do this by setting action to startDebugging with a name property set to the name of the launch configuration to start when the pattern is matched.
Here the serverReadyAction feature in action:

Next steps
To learn about VS Code’s Node.js debugging support, take a look at:
To see tutorials on the basics of Node.js debugging, check out these videos:
To learn about debugging support for other programming languages via VS Code extensions:
To learn about VS Code’s task running support, go to:
To write your own debugger extension, visit: